Dashboard
Your home screen for "where do I stand today?" — headline totals, net-worth trend, how you're split across holdings, and the detail behind every line. It opens by default.
How to use
- Open the filters and narrow the view by Account, Asset, Risk, Category, Provider, or Ticker. Each accepts more than one choice; leave one empty to include everything in it.
- Keep Hide empty on to drop holdings you no longer hold; turn it off to see them. Use Reset to clear all filters.
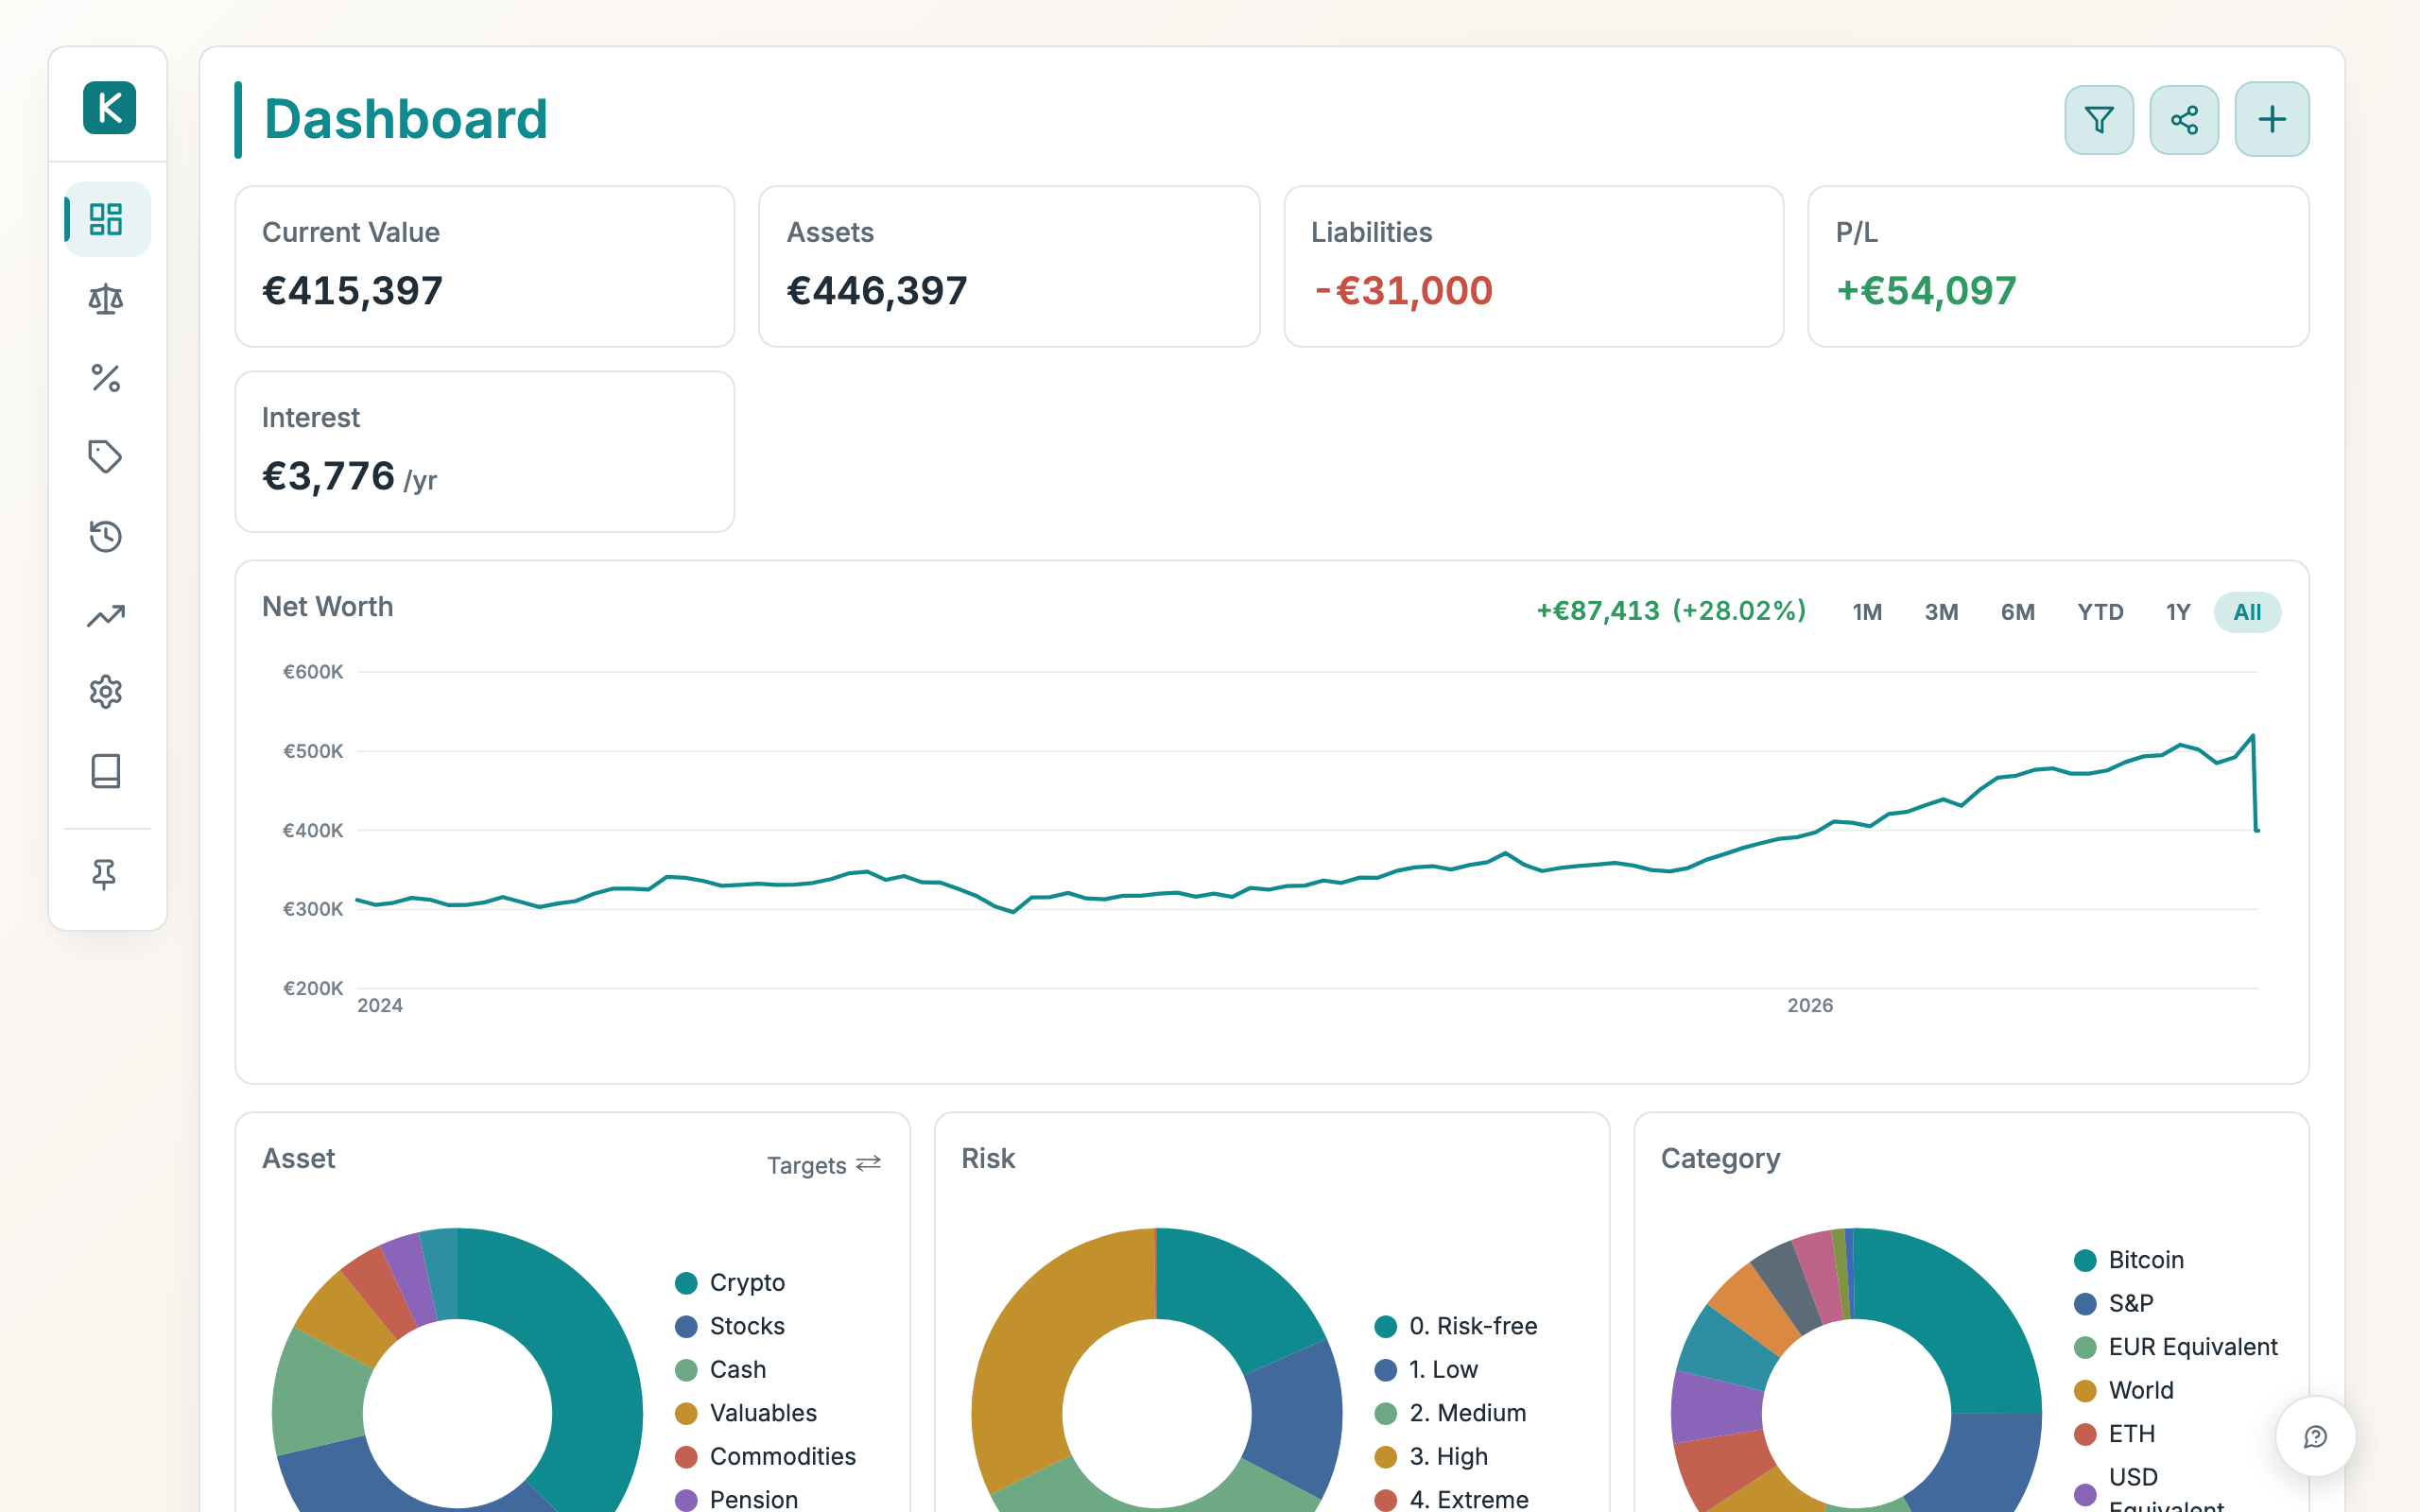
- Read the cards at the top: Current Value, P/L, and Interest. When you hold debts, Assets and Liabilities cards also appear. Click any money figure to flip it between euros and dollars.
- Watch the Net Worth History chart for your daily trend.
- Use the donut charts below it — Account, Asset, Risk, Category, Provider, Ticker — to see how you're split.
- Drill into individual positions in the detail table at the bottom. Click a column heading to sort.
- Use Add to log a trade or a holding, or Share snapshot to send the current picture.
Good to know
- Holdings whose Asset is Pension are left out of the net-worth trend, so retirement savings you can't touch don't move the line.
- Hide empty and the filters affect the cards, donuts, and table — not the trend chart.
- The trend records one point per day automatically, whether or not you open the app.
- These filters are the Dashboard's own, separate from the Balance Sheet — changing one doesn't change the other.