Balance Sheet
A snapshot of everything you hold right now, with current value, what you invested, realized gains and total profit/loss. View it line by line or rolled up by ticker.
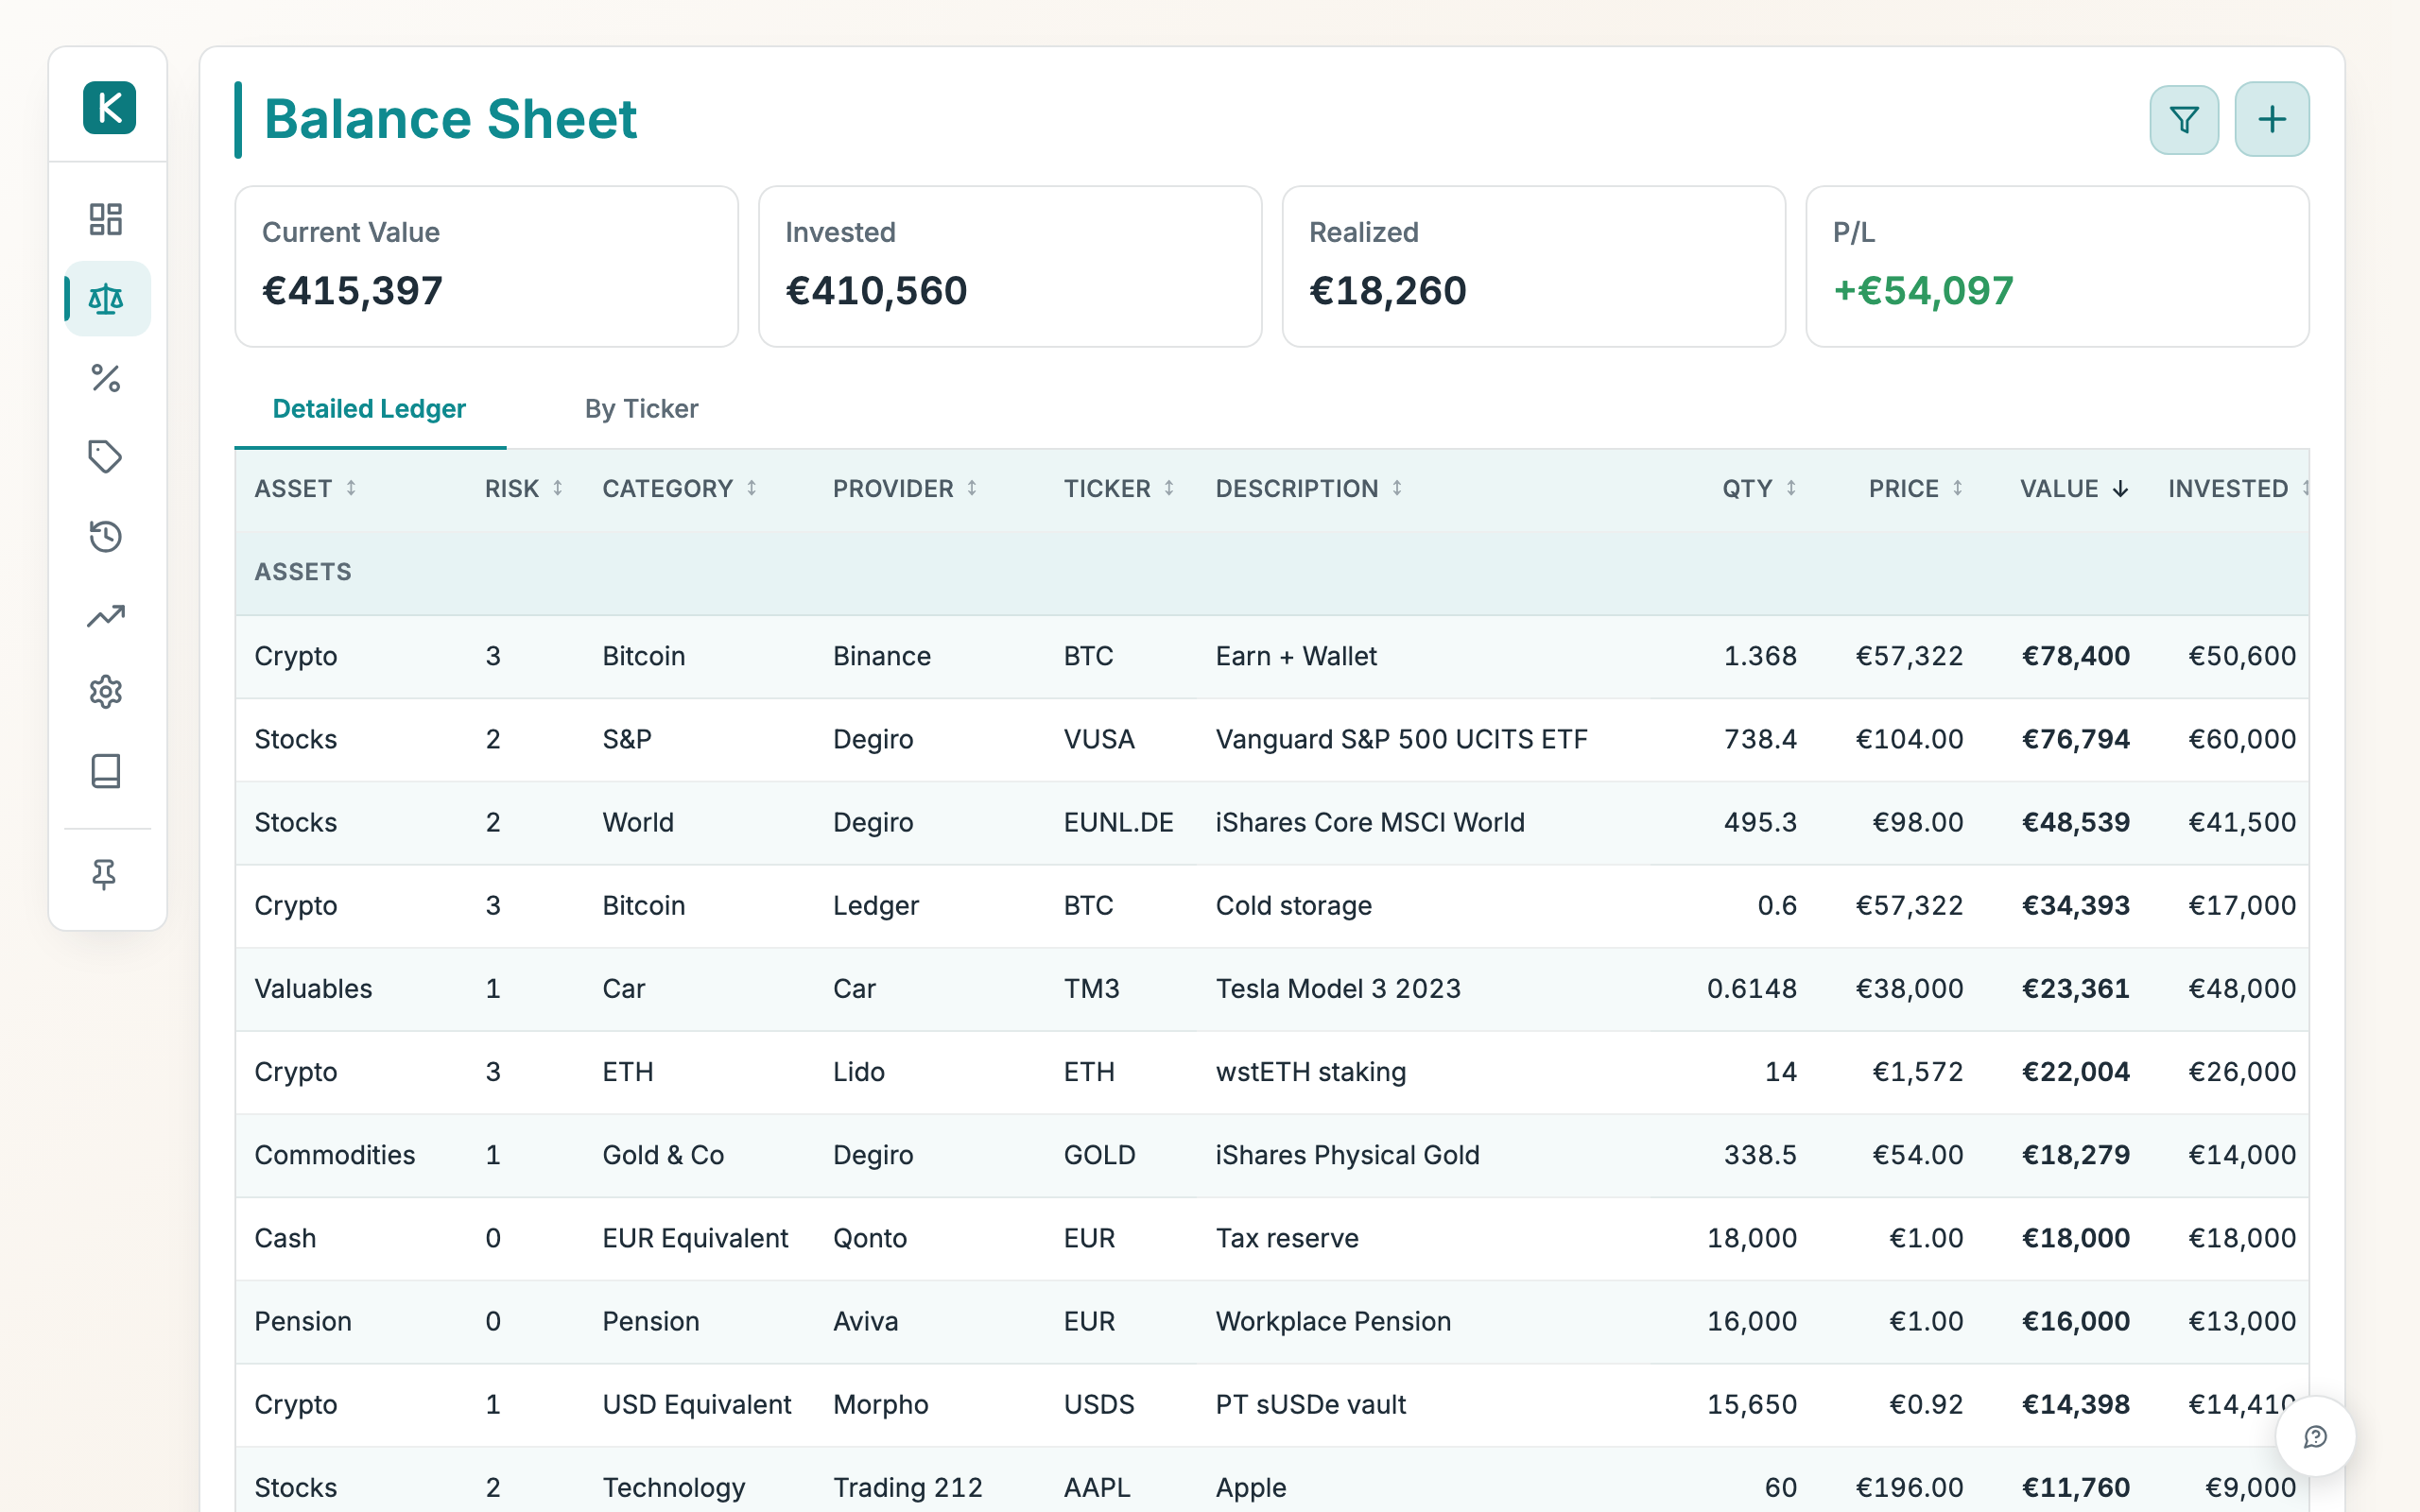
How to use
- Open the Balance Sheet tab. It opens on the Detailed Ledger view; switch to By Ticker with the links above the table.
- Tap the funnel icon to open the filter bar, then narrow by Account, Asset, Risk, Category, Provider or Ticker. Leave Hide empty on to skip holdings with no current value, or Reset to clear everything.
- Read the cards above the table — Current Value, Invested, Realized and P/L — which follow your filters.
- Click any column header to sort. Click the Price header to switch the price column between euros and the asset's native currency.
- Use the Add (+) menu to record an Add trade or Add holding (including a liability).
- In Detailed Ledger, open a row's ⋮ menu to Edit the line (set a manual quantity or override its account, ticker, provider, category or description), exclude or include it in P/L, or refresh its quantity or price.
Good to know
- By Ticker merges lines that share a ticker, so provider, account and description drop out of that view. Switch to Detailed Ledger to see them.
- When you hold any liabilities, Detailed Ledger splits into Assets and Liabilities groups, each with its own subtotal, closed by a Net worth line.
- A manual override sticks until you clear it through the same Edit menu — it replaces the calculated value for that line.
- A Price Gaps card appears when holdings in view have no current price.