Forecast
Projects your net worth up to five years out from your current holdings, so you can see where your savings rate and asset mix are headed. It blends your real holdings with assumptions you set — salary, expenses, growth rates, tax and inflation — and shows what's driving the gain.
How to use
- The first time, click New forecast to start with sensible defaults and open the editor.
- In the Forecast assumptions editor, under Income, enter your Monthly salary (net, €).
- Under Expenses, fill in your monthly amounts. Whatever's left of your salary each month is treated as savings flowing into your net worth.
- Under Tax & Inflation, adjust Capital gains tax (%) and Inflation (%) if the defaults don't fit.
- Under Asset growth rates, set an expected annual return for each asset class.
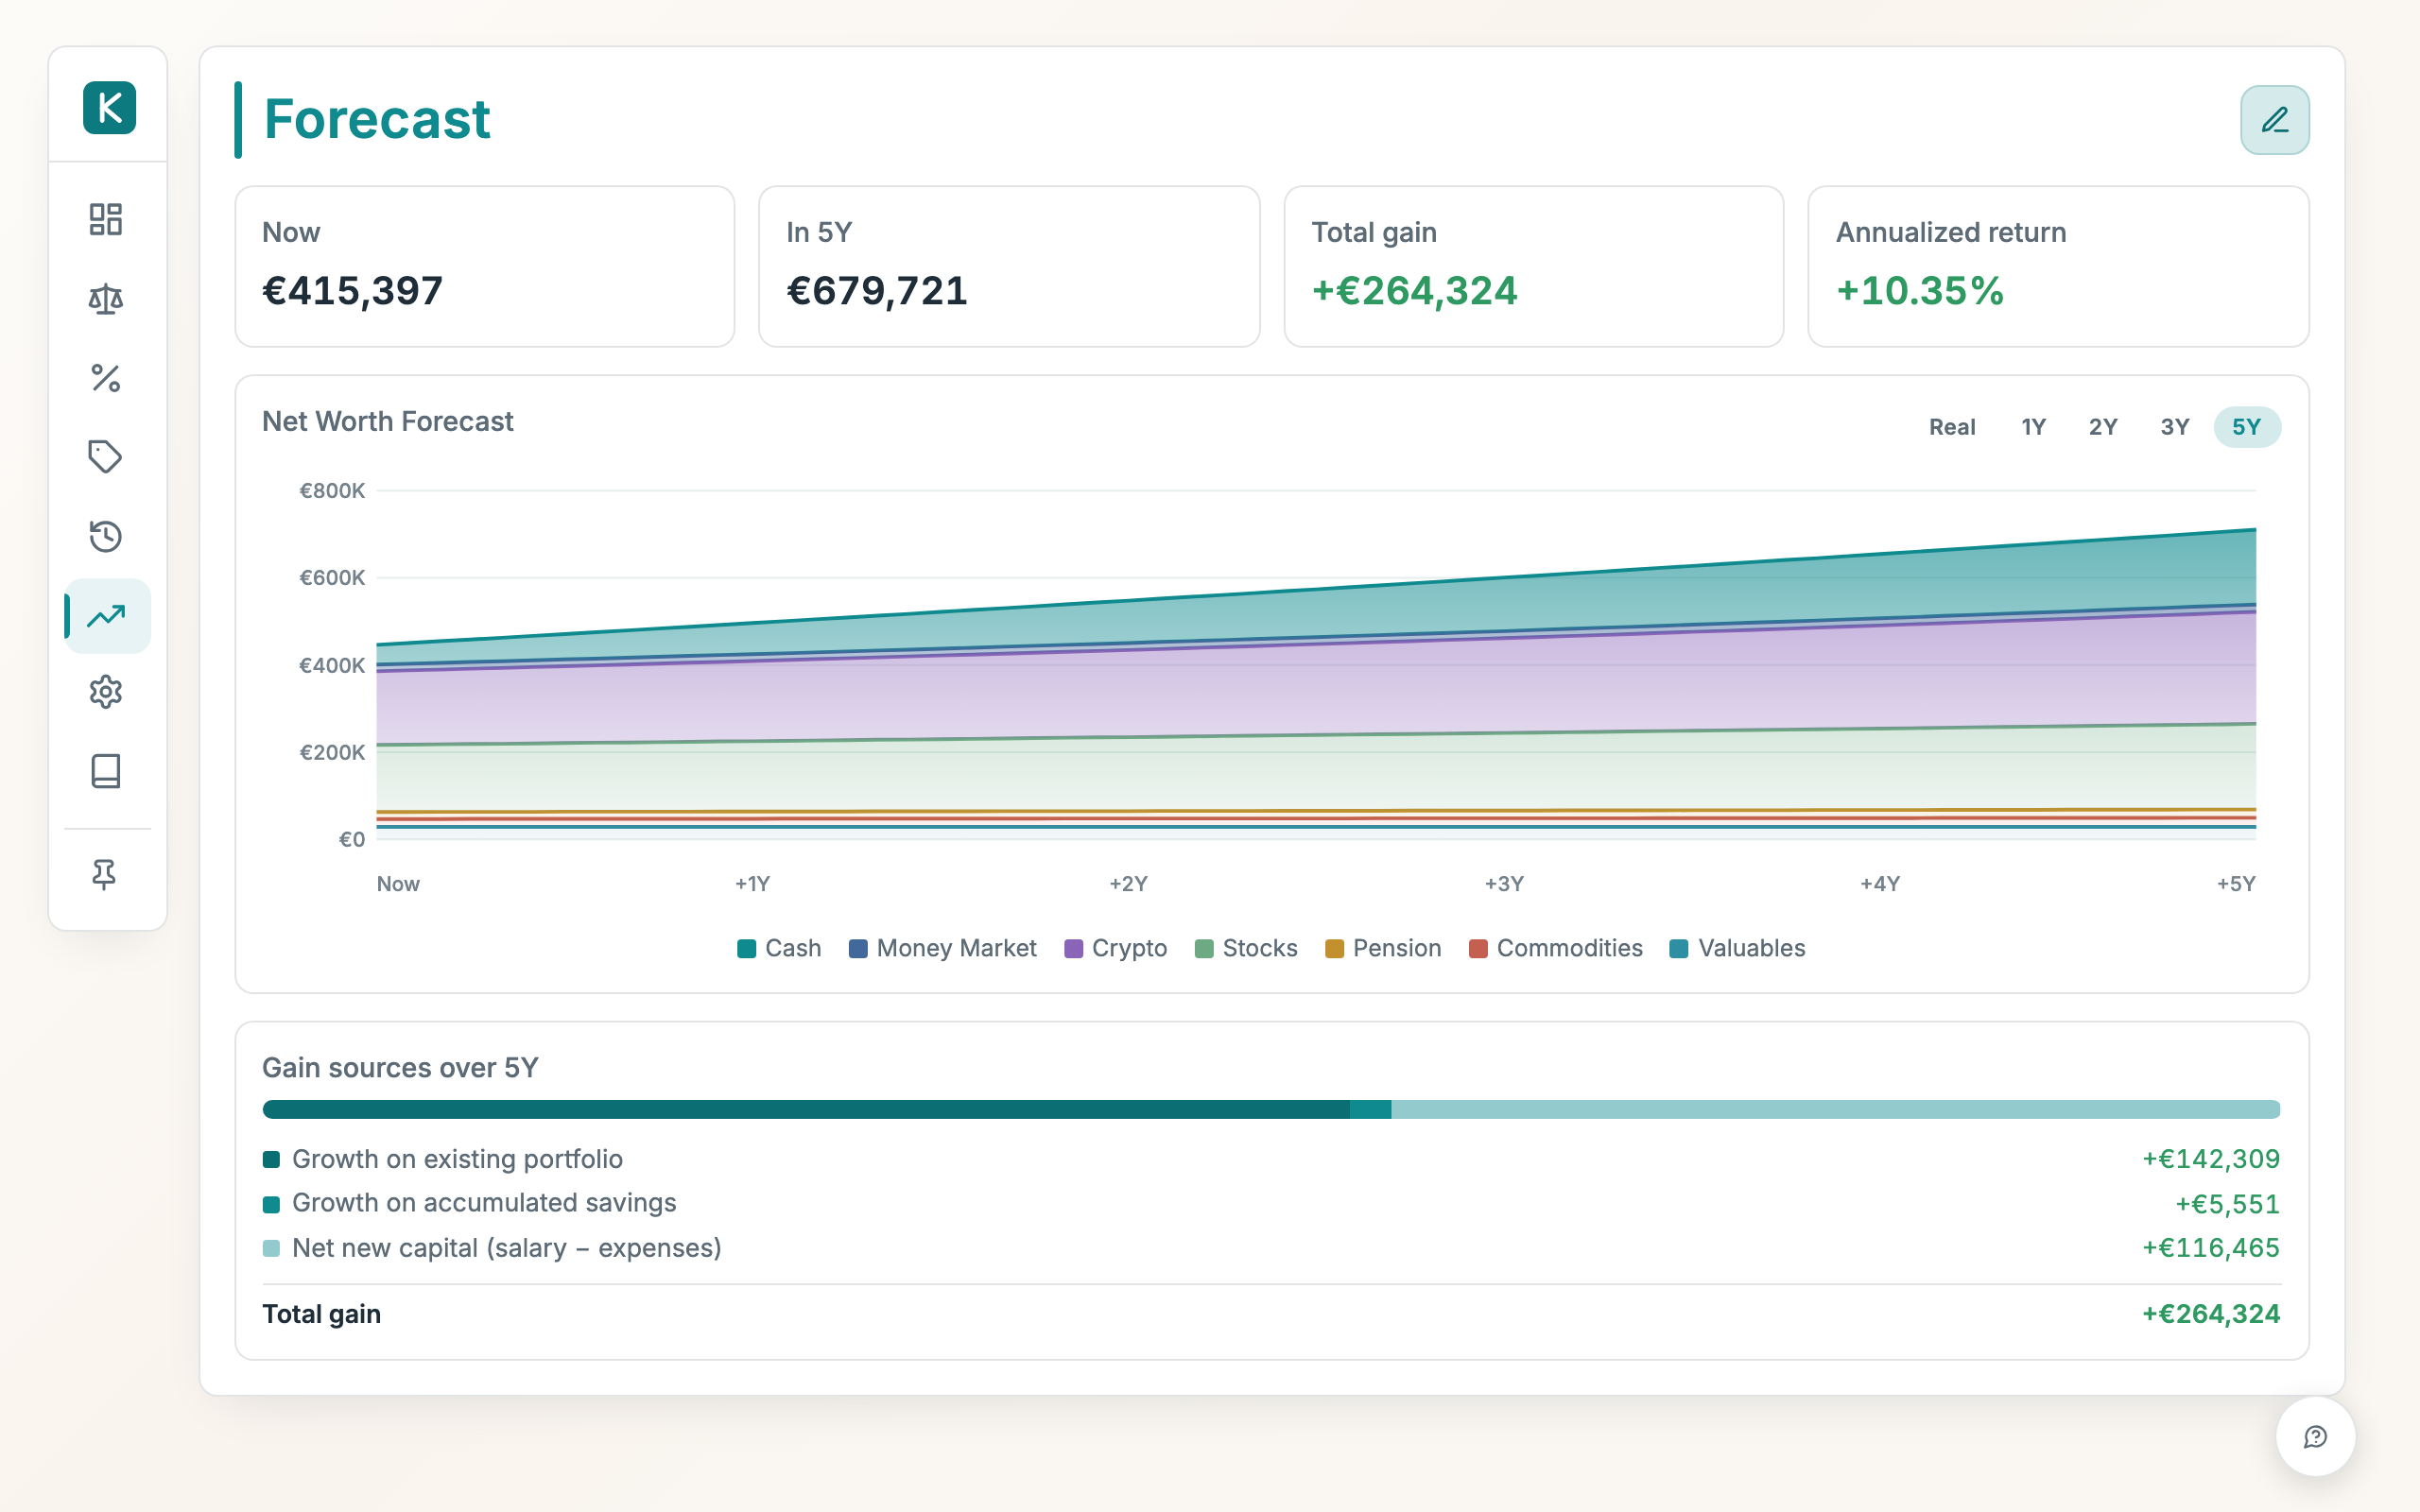
- Click Done. The chart and the cards at the top (Now, In 5Y, Total gain, Annualized return) update as you type.
- Use the range buttons (1Y, 2Y, 3Y, 5Y) on the chart to change the horizon, and read the Gain sources card to see how much comes from existing holdings, accumulated savings, and new capital.
To change anything later, click the Edit assumptions (pencil) button next to the title.
Good to know
- The projection starts from your current holdings. With nothing on your balance sheet there's nothing to project, so add a holding first.
- Turn on the Real button on the chart to see future values in today's purchasing power, after inflation.
- Each month's savings (salary minus expenses) are added to your cash, then grow at the rates you set; expenses rise each year with inflation.
- Growth rates are assumptions, not advice. The defaults are deliberately conservative placeholders.
- Your assumptions save automatically, so they're waiting for you next time.
- Everything is in euros, like the rest of the app.